This post describes how to build a very basic
connected scatter plot
with d3.js. Note that it is basically a
line chart with data points represented as
well. Learn more about the theory of connected scatter plot in
data-to-viz.com. This example works with d3.js v4 and v6
<!DOCTYPE html><metacharset="utf-8"><!-- Load d3.js --><scriptsrc="https://d3js.org/d3.v4.js"></script><!-- Create a div where the graph will take place --><divid="my_dataviz"></div>
<!DOCTYPE html><metacharset="utf-8"><!-- Load d3.js --><scriptsrc="https://d3js.org/d3.v6.js"></script><!-- Create a div where the graph will take place --><divid="my_dataviz"></div>
<script>// set the dimensions and margins of the graphvar margin ={top:10, right:30, bottom:30, left:60},
width =460- margin.left - margin.right,
height =400- margin.top - margin.bottom;// append the svg object to the body of the pagevar svg = d3.select("#my_dataviz").append("svg").attr("width", width + margin.left + margin.right).attr("height", height + margin.top + margin.bottom).append("g").attr("transform","translate("+ margin.left +","+ margin.top +")");//Read the data
d3.csv("https://raw.githubusercontent.com/holtzy/D3-graph-gallery/master/DATA/connectedscatter.csv",// When reading the csv, I must format variables:function(d){return{ date : d3.timeParse("%Y-%m-%d")(d.date), value : d.value }},// Now I can use this dataset:function(data){// Add X axis --> it is a date formatvar x = d3.scaleTime().domain(d3.extent(data,function(d){return d.date;})).range([0, width ]);
svg.append("g").attr("transform","translate(0,"+ height +")").call(d3.axisBottom(x));// Add Y axisvar y = d3.scaleLinear().domain([8000,9200]).range([ height,0]);
svg.append("g").call(d3.axisLeft(y));// Add the line
svg.append("path").datum(data).attr("fill","none").attr("stroke","#69b3a2").attr("stroke-width",1.5).attr("d", d3.line().x(function(d){returnx(d.date)}).y(function(d){returny(d.value)}))// Add the points
svg
.append("g").selectAll("dot").data(data).enter().append("circle").attr("cx",function(d){returnx(d.date)}).attr("cy",function(d){returny(d.value)}).attr("r",5).attr("fill","#69b3a2")})</script>
<script>// set the dimensions and margins of the graphconst margin ={top:10, right:30, bottom:30, left:60},
width =460- margin.left - margin.right,
height =400- margin.top - margin.bottom;// append the svg object to the body of the pageconst svg = d3.select("#my_dataviz").append("svg").attr("width", width + margin.left + margin.right).attr("height", height + margin.top + margin.bottom).append("g").attr("transform",`translate(${margin.left},${margin.top})`);//Read the data
d3.csv("https://raw.githubusercontent.com/holtzy/D3-graph-gallery/master/DATA/connectedscatter.csv",// When reading the csv, I must format variables:function(d){return{ date : d3.timeParse("%Y-%m-%d")(d.date), value : d.value }}).then(// Now I can use this dataset:function(data){// Add X axis --> it is a date formatconst x = d3.scaleTime().domain(d3.extent(data, d => d.date)).range([0, width ]);
svg.append("g").attr("transform","translate(0,"+ height +")").call(d3.axisBottom(x));// Add Y axisconst y = d3.scaleLinear().domain([8000,9200]).range([ height,0]);
svg.append("g").call(d3.axisLeft(y));// Add the line
svg.append("path").datum(data).attr("fill","none").attr("stroke","#69b3a2").attr("stroke-width",1.5).attr("d", d3.line().x(d =>x(d.date)).y(d =>y(d.value)))// Add the points
svg
.append("g").selectAll("dot").data(data).join("circle").attr("cx", d =>x(d.date)).attr("cy", d =>y(d.value)).attr("r",5).attr("fill","#69b3a2")})</script>
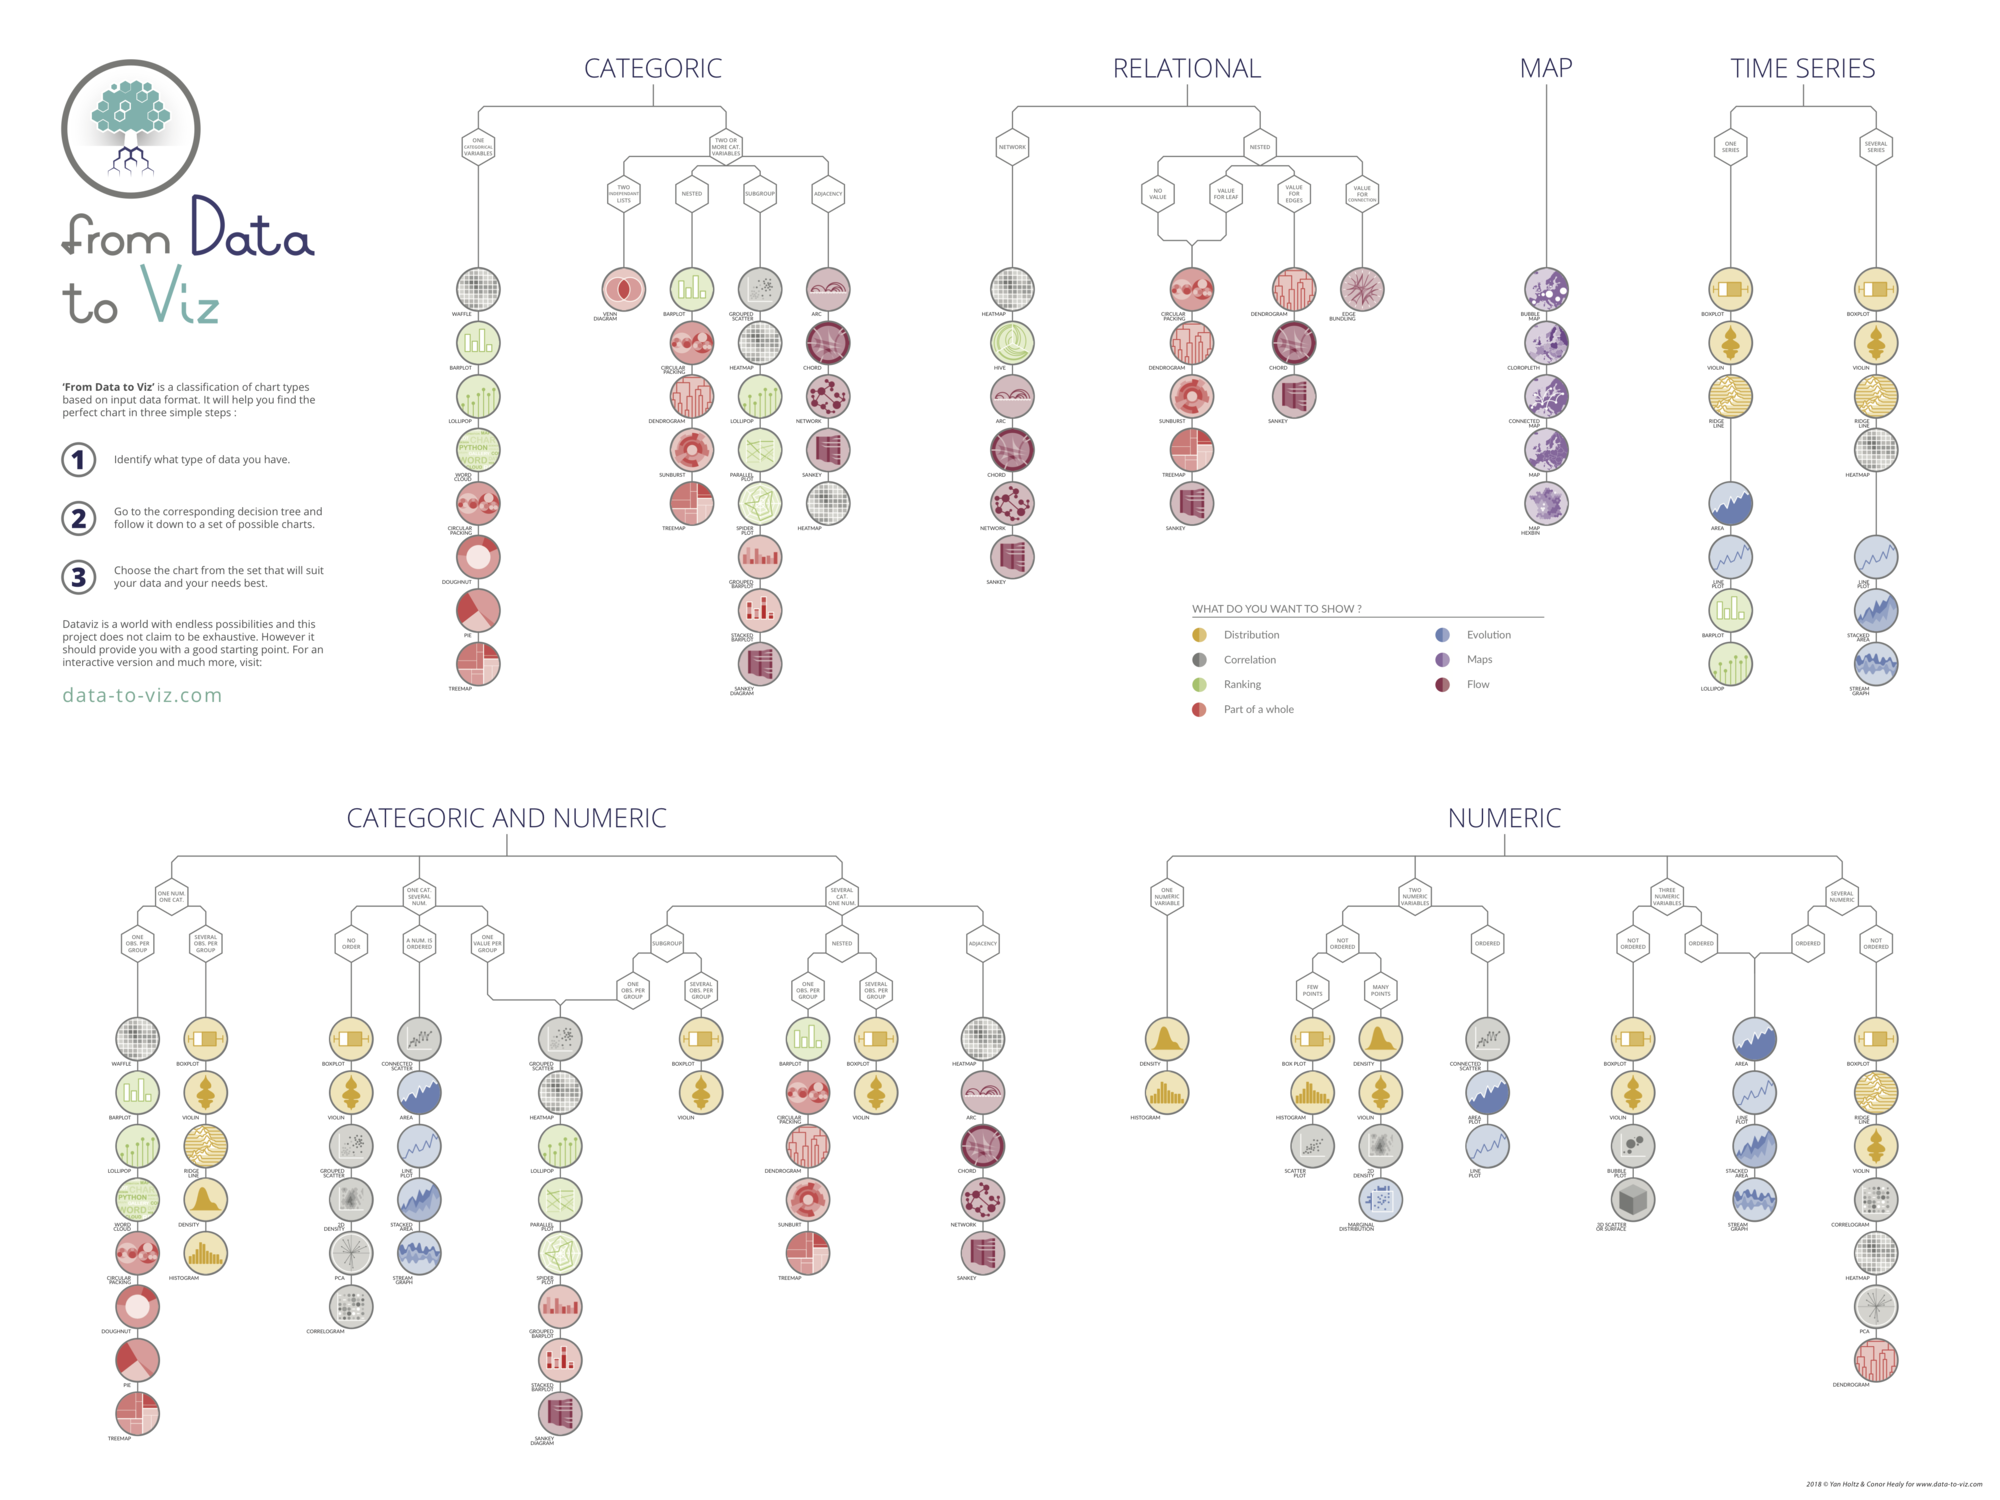
Wondering what chart type you should use? Check my
Data To Viz project! It is a
comprehensive classification of chart types organized by data
input format. Get a high-resolution version of the decision tree in your
inbox now!