The D3 Graph Gallery helps you build any chart with
Javascript.
However, choosing the most appropriate chart type for
your dataset can be challenging.
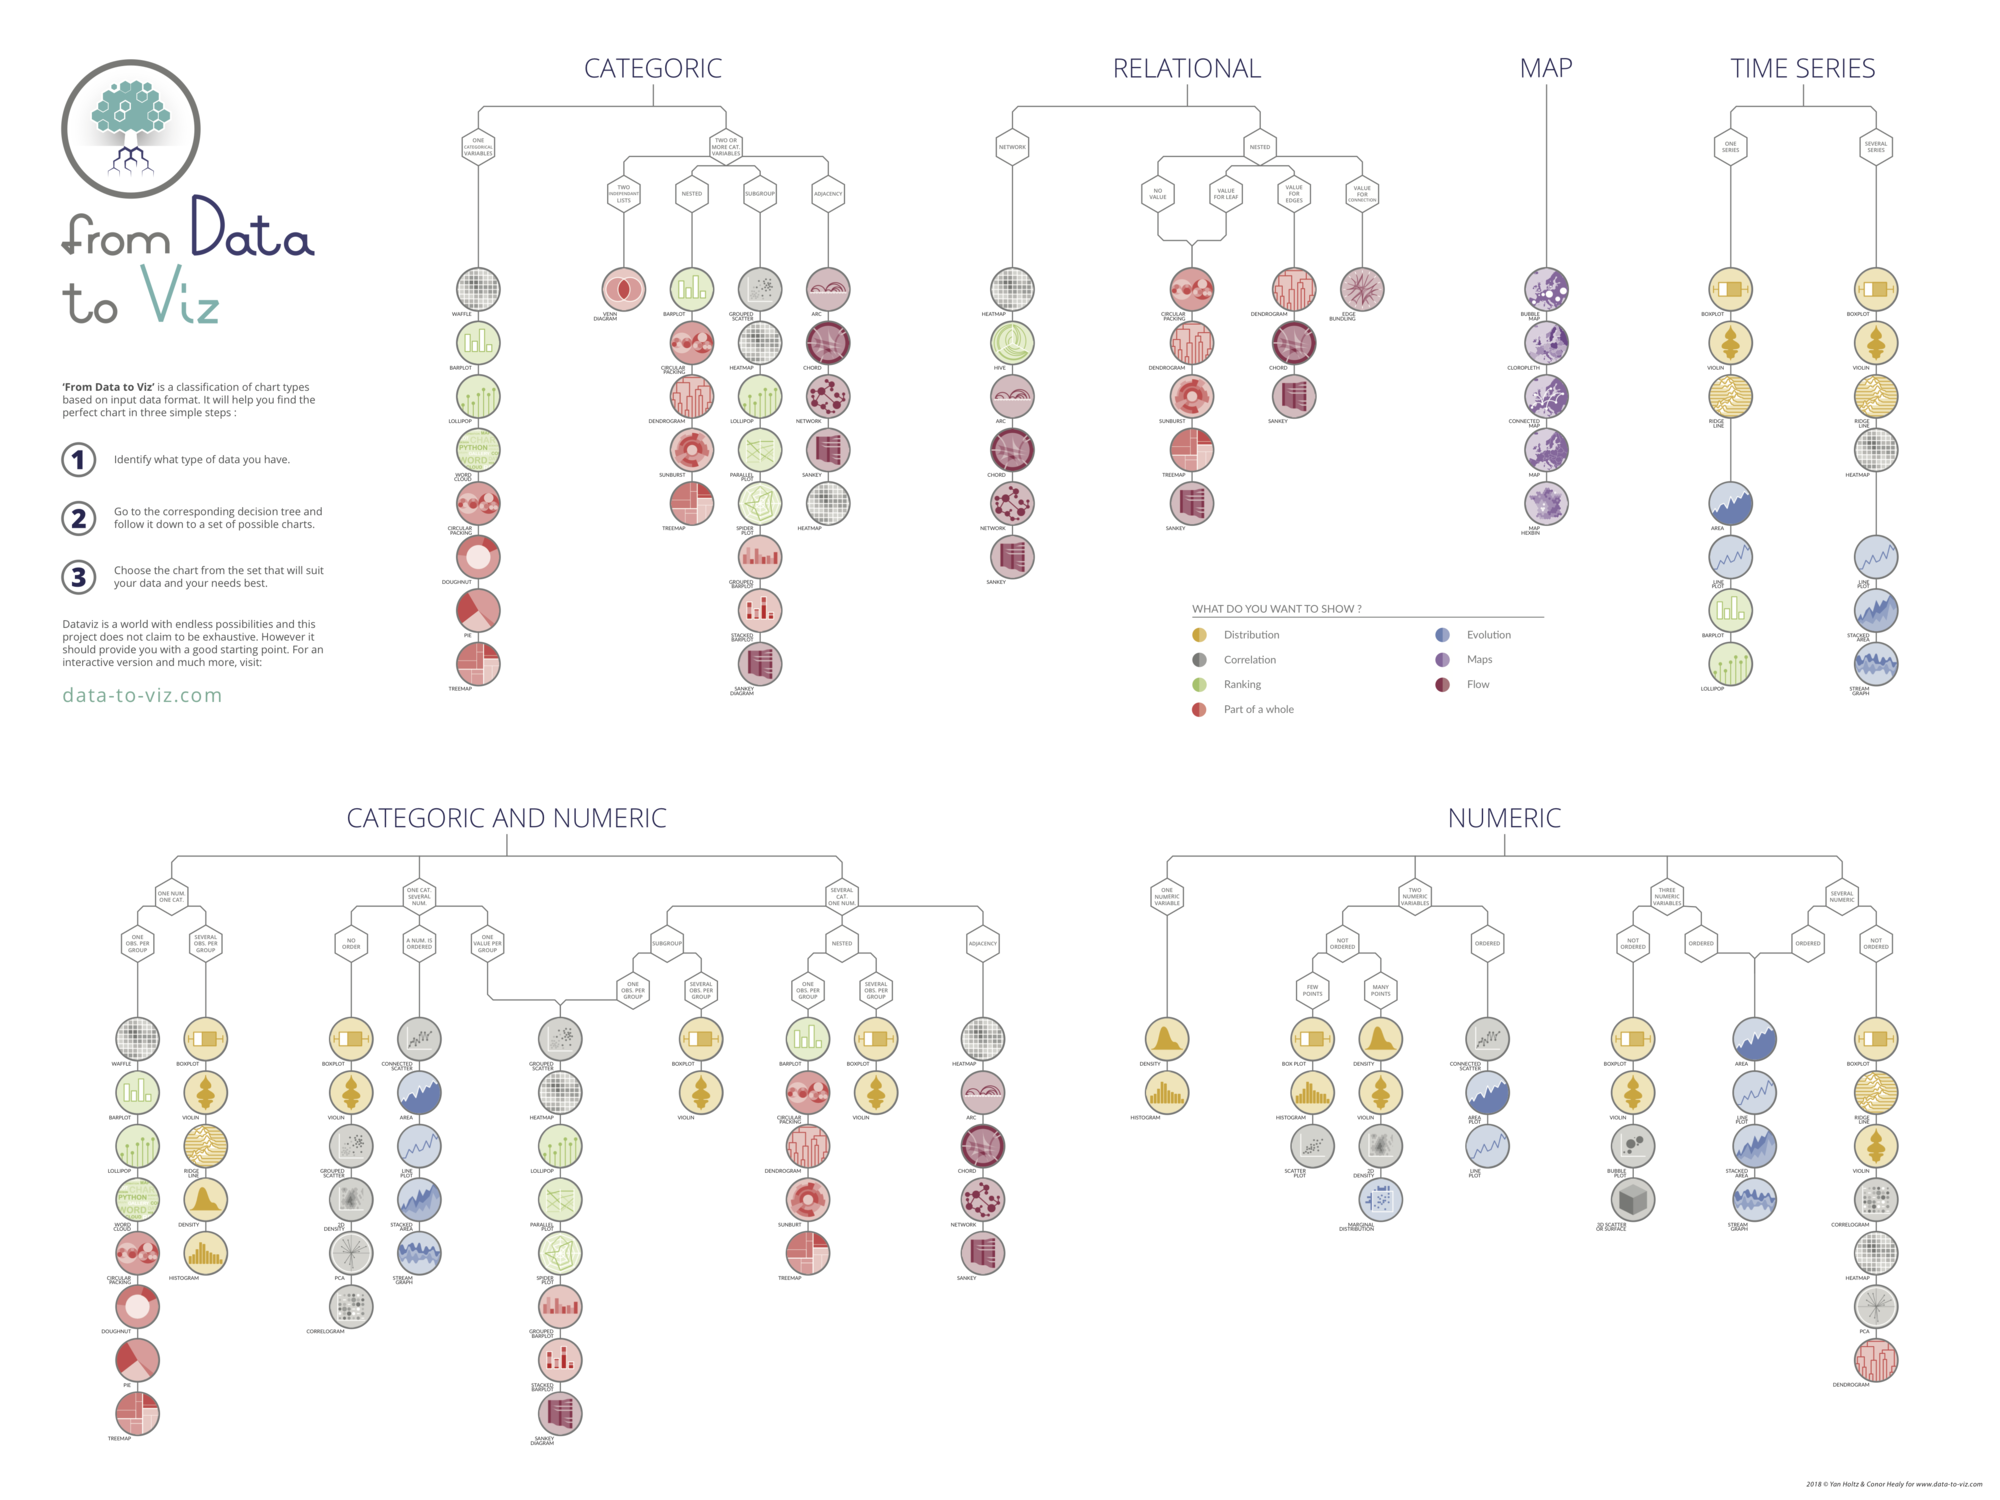
My project,
Data To Viz,
addresses this issue. It provides a
decision tree that guides you to the
ideal chart for your data.
If you're interested, I can send you a high-resolution
version of the poster directly to your inbox!
Highlight links in arc diagram on hover
This post follows the previous
basic arc diagram. It shows how to add a
functionality: when hovering a node, links associated with this
nodes are highlighted. Visit the
arc diagram section for more example. This
example works with d3.js v4 and v6
Data input format is Json.
This document
explains how to get this format from a classic table.
Plotting the nodes is pretty straightforward: a
scalePoint() is set to
distribute them uniformly along the X axis. They are then
added using a classing
append("circle") approach.
Drawing links is a bit tricky. Code is highly commented and
should allow to understand the basic process.
|
<!DOCTYPE html><metacharset="utf-8"><!-- Load d3.js --><scriptsrc="https://d3js.org/d3.v4.js"></script><!-- Create a div where the graph will take place --><divid="my_dataviz"></div>
<!DOCTYPE html><metacharset="utf-8"><!-- Load d3.js --><scriptsrc="https://d3js.org/d3.v6.js"></script><!-- Create a div where the graph will take place --><divid="my_dataviz"></div>
<script>// set the dimensions and margins of the graphvar margin ={top:20, right:30, bottom:20, left:30},
width =450- margin.left - margin.right,
height =300- margin.top - margin.bottom;// append the svg object to the body of the pagevar svg = d3.select("#my_dataviz").append("svg").attr("width", width + margin.left + margin.right).attr("height", height + margin.top + margin.bottom).append("g").attr("transform","translate("+ margin.left +","+ margin.top +")");// Read dummy data
d3.json("https://raw.githubusercontent.com/holtzy/D3-graph-gallery/master/DATA/data_network.json",function( data){// List of node namesvar allNodes = data.nodes.map(function(d){return d.name})// A linear scale to position the nodes on the X axisvar x = d3.scalePoint().range([0, width]).domain(allNodes)// Add the circle for the nodesvar nodes = svg
.selectAll("mynodes").data(data.nodes).enter().append("circle").attr("cx",function(d){return(x(d.name))}).attr("cy", height-30).attr("r",8).style("fill","#69b3a2")// And give them a labelvar labels = svg
.selectAll("mylabels").data(data.nodes).enter().append("text").attr("x",function(d){return(x(d.name))}).attr("y", height-10).text(function(d){return(d.name)}).style("text-anchor","middle")// Add links between nodes. Here is the tricky part.// In my input data, links are provided between nodes -id-, NOT between node names.// So I have to do a link between this id and the namevar idToNode ={};
data.nodes.forEach(function(n){
idToNode[n.id]= n;});// Cool, now if I do idToNode["2"].name I've got the name of the node with id 2// Add the linksvar links = svg
.selectAll('mylinks').data(data.links).enter().append('path').attr('d',function(d){
start =x(idToNode[d.source].name)// X position of start node on the X axis
end =x(idToNode[d.target].name)// X position of end nodereturn['M', start, height-30,// the arc starts at the coordinate x=start, y=height-30 (where the starting node is)'A',// This means we're gonna build an elliptical arc(start - end)/2,',',// Next 2 lines are the coordinates of the inflexion point. Height of this point is proportional with start - end distance(start - end)/2,0,0,',',
start < end ?1:0, end,',', height-30]// We always want the arc on top. So if end is before start, putting 0 here turn the arc upside down..join(' ');}).style("fill","none").attr("stroke","black")// Add the highlighting functionality
nodes
.on('mouseover',function(d){// Highlight the nodes: every node is green except of him
nodes.style('fill',"#B8B8B8")
d3.select(this).style('fill','#69b3b2')// Highlight the connections
links
.style('stroke',function(link_d){return link_d.source === d.id || link_d.target === d.id ?'#69b3b2':'#b8b8b8';}).style('stroke-width',function(link_d){return link_d.source === d.id || link_d.target === d.id ?4:1;})}).on('mouseout',function(d){
nodes.style('fill',"#69b3a2")
links
.style('stroke','black').style('stroke-width','1')})})// text hover nodes
svg
.append("text").attr("text-anchor","middle").style("fill","#B8B8B8").style("font-size","17px").attr("x",50).attr("y",10).html("Hover nodes")</script>
<script>// set the dimensions and margins of the graphconst margin ={top:20, right:30, bottom:20, left:30},
width =450- margin.left - margin.right,
height =300- margin.top - margin.bottom;// append the svg object to the body of the pageconst svg = d3.select("#my_dataviz").append("svg").attr("width", width + margin.left + margin.right).attr("height", height + margin.top + margin.bottom).append("g").attr("transform",`translate(${margin.left},${margin.top})`);// Read dummy data
d3.json("https://raw.githubusercontent.com/holtzy/D3-graph-gallery/master/DATA/data_network.json").then(function(data){// List of node namesconst allNodes = data.nodes.map(d=>d.name)// A linear scale to position the nodes on the X axisconst x = d3.scalePoint().range([0, width]).domain(allNodes)// Add the circle for the nodesconst nodes = svg
.selectAll("mynodes").data(data.nodes).join("circle").attr("cx", d =>x(d.name)).attr("cy", height-30).attr("r",8).style("fill","#69b3a2")// And give them a labelconst labels = svg
.selectAll("mylabels").data(data.nodes).join("text").attr("x", d=>x(d.name)).attr("y", height-10).text(d=>(d.name)).style("text-anchor","middle")// Add links between nodes. Here is the tricky part.// In my input data, links are provided between nodes -id-, NOT between node names.// So I have to do a link between this id and the nameconst idToNode ={};
data.nodes.forEach(function(n){
idToNode[n.id]= n;});// Cool, now if I do idToNode["2"].name I've got the name of the node with id 2// Add the linksconst links = svg
.selectAll('mylinks').data(data.links).join('path').attr('d', d=>{
start =x(idToNode[d.source].name)// X position of start node on the X axis
end =x(idToNode[d.target].name)// X position of end nodereturn['M', start, height-30,// the arc starts at the coordinate x=start, y=height-30 (where the starting node is)'A',// This means we're gonna build an elliptical arc(start - end)/2,',',// Next 2 lines are the coordinates of the inflexion point. Height of this point is proportional with start - end distance(start - end)/2,0,0,',',
start < end ?1:0, end,',', height-30]// We always want the arc on top. So if end is before start, putting 0 here turn the arc upside down..join(' ');}).style("fill","none").attr("stroke","black")// Add the highlighting functionality
nodes
.on('mouseover',function(event,d){// Highlight the nodes: every node is green except of him
nodes.style('fill',"#B8B8B8")
d3.select(this).style('fill','#69b3b2')// Highlight the connections
links
.style('stroke', a=> a.source === d.id || a.target === d.id ?'#69b3b2':'#b8b8b8').style('stroke-width', a=>a.source === d.id || a.target === d.id ?4:1)}).on('mouseout',function(event,d){
nodes.style('fill',"#69b3a2")
links
.style('stroke','black').style('stroke-width','1')})// text hover nodes
svg
.append("text").attr("text-anchor","middle").style("fill","#B8B8B8").style("font-size","17px").attr("x",50).attr("y",10).html("Hover nodes")})</script>
Wondering what chart type you should use? Check my
Data To Viz project! It is a
comprehensive classification of chart types organized by data
input format. Get a high-resolution version of the decision tree in your
inbox now!


 X
X